Info
Manual downloadProvided By
Ivanti
Ivanti File Director – Splunk Dashboards
Use Splunk to receive and correctly interpret File Director syslog events. The downloads on this page contain sample reports, dashboards and setup instructions.
There are three dashboards available out of the box:
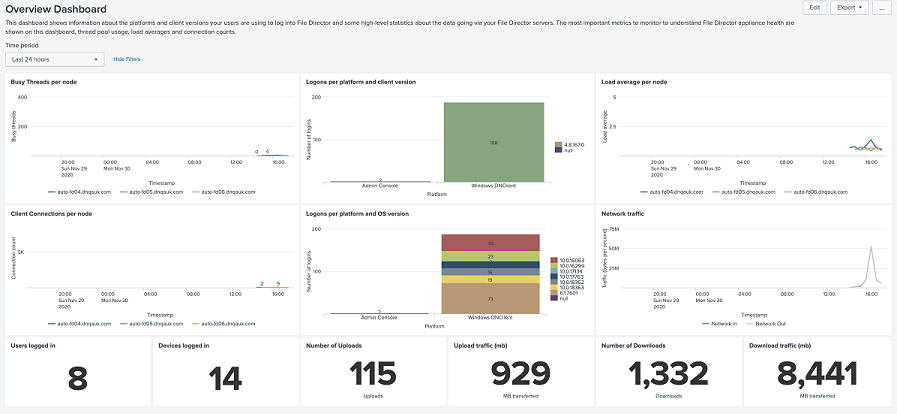
- Overview - shows information about the platforms and client versions your users are using to log into File Director and some high-level statistics about the data going via your File Director servers. The most important metrics to monitor to understand File Director appliance health are shown on this dashboard, thread pool usage, load averages and connection counts.

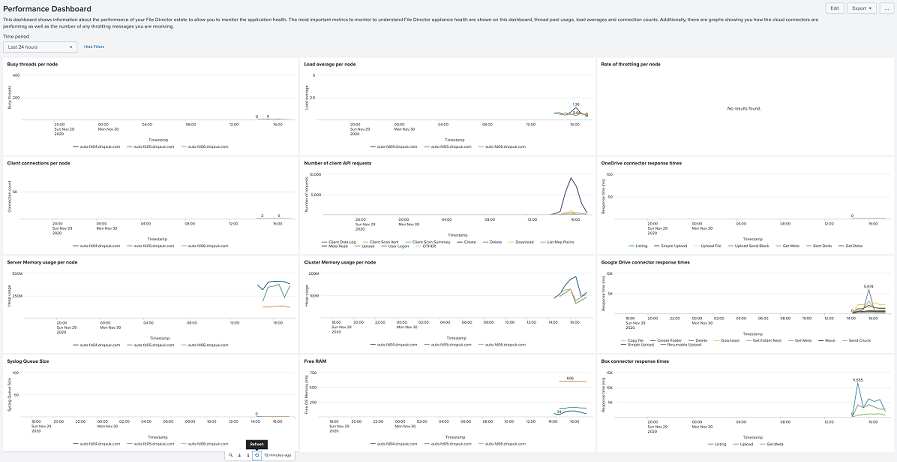
- Performance - shows information about the performance of your File Director estate to allow you to monitor the application health. The most important metrics to monitor to understand File Director appliance health are shown on this dashboard, thread pool usage, load averages and connection counts. Additionally, there are graphs showing you how the cloud connectors are performing as well as the number of any throttling messages you are receiving.

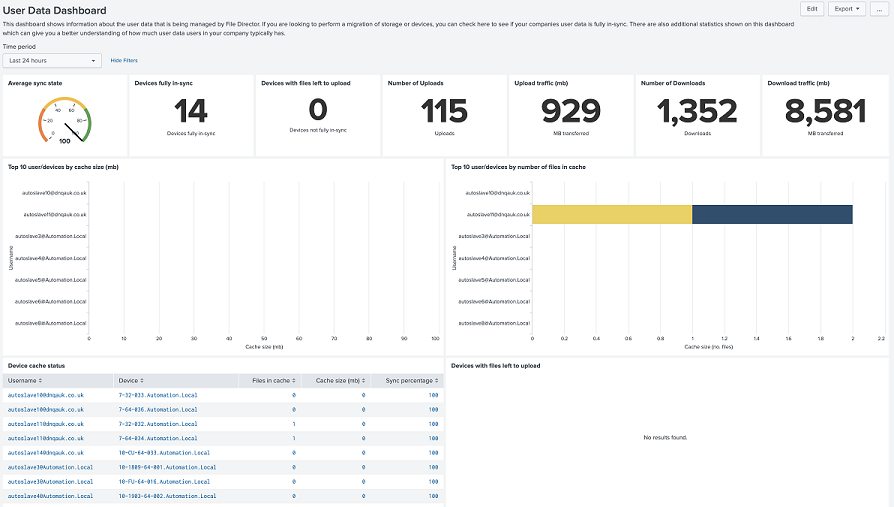
- User Data - shows information about the user data that is being managed by File Director. If you are looking to perform a migration of storage or devices, you can check here to see if your companies user data is fully in-sync. There are also additional statistics shown on this dashboard which can give you a better understanding of how much user data users in your company typically has.

Please Note: To use these solutions, first download and install the unpackager tool from here. Once you’ve found a solution you’re interested in, just download it and use the unpacking tool to open up the solution and use it.
